
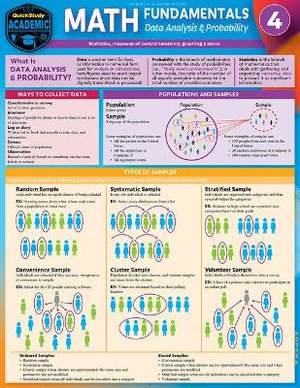
Math Fundamentals 4 - Data Analysis & Probability
A Quickstudy Laminated Reference Guide
By: Peggy Warren, Susan Wright, Expolog LLC
Fold-Out Book or Chart | 30 January 2022 | Edition Number 2
At a Glance
Fold-Out Book or Chart
RRP $19.99
$17.99
10%OFF
Ships in 5 to 10 business days
ISBN: 9781423247272
ISBN-10: 1423247272
Series: Math Fundamentals
Published: 30th January 2022
Format: Fold-Out Book or Chart
Language: English
Number of Pages: 6
Audience: General Adult
Publisher: BARCHARTS PUBLISHING
Edition Number: 2
Dimensions (cm): 27.94 x 21.59 x 0.15
Weight (kg): 0.41
Shipping
| Standard Shipping | Express Shipping | |
|---|---|---|
| Metro postcodes: | $9.99 | $14.95 |
| Regional postcodes: | $9.99 | $14.95 |
| Rural postcodes: | $9.99 | $14.95 |
Orders over $89.00 qualify for free shipping.
How to return your order
At Booktopia, we offer hassle-free returns in accordance with our returns policy. If you wish to return an item, please get in touch with Booktopia Customer Care.
Additional postage charges may be applicable.
Defective items
If there is a problem with any of the items received for your order then the Booktopia Customer Care team is ready to assist you.
For more info please visit our Help Centre.
You Can Find This Book In

RRP $26.99
$22.99
OFF


RRP $26.99
$22.99
OFF

RRP $76.00
$36.99
OFF


$442.75

$416.75


$431.99

RRP $26.99
$22.99
OFF


RRP $26.99
$22.99
OFF

RRP $45.00
$32.75
OFF

RRP $19.99
$18.75
RRP $221.75
$133.99
OFF

RRP $26.99
$22.99
OFF

RRP $79.95
$62.99
OFF

RRP $49.95
$37.99
OFF