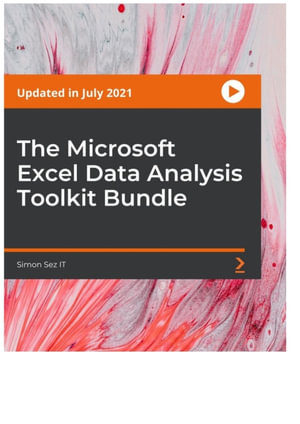
A complete guide to the Microsoft Excel data analysis
Key Features
- Learn how to merge data from various sources using VLOOKUP, HLOOKUP, INDEX MATCH, and XLOOKUP
- Learn how to create amazing looking dashboards using PivotTables
- Learn how to use Goal Seek, Scenario Manager, and Solver to fill data gaps in Excel
Book Description
In this four-course bundle, we look at a number of advanced Excel techniques all aimed at helping you make sense of the numbers in your business.
In Excel for business analysts, you will learn to clean raw data and look at a number of tools and functions that can be used to conduct analysis. Finally, we move onto some more advanced techniques designed to aid forecasting and use existing data to predict future trends.
In Advanced Excel 2019, you will gain an in-depth understanding of more advanced Excel features that delve into high-level consolidation, analysis, and reporting of financial information.
Advanced PivotTables starts with a PivotTable refresher and then goes on to discuss advanced sorting, slicers, timelines, calculated fields, pivot charts, and conditional formatting.
In Advanced Formulas, learn the Excel formulas and tools that enable you to perform complex tasks and analyses.
Filtering a dataset, sorting using formulas, creating multi-dependent drop-down lists, 2-way look-ups, text extraction, dynamic chart titles, and XLOOKUP are a few of the exciting concepts covered in the course.
By the end of the course, you will become an expert in data analysis with Excel.
You can find all the resources for the course at https://github.com/PacktPublishing/The-Microsoft-Excel-Data-Analysis-Toolkit-Bundle
What you will learn
- How to standardize and clean data ready for analysis in Excel
- How to format a PivotTable, including adjusting styles
- Create multi-dependent dynamic drop-down lists in Excel
- Learn all about histograms and regression in Excel
- Conduct a linear forecast and forecast smoothing in Excel
- Automate repetitive tasks in Excel using macros
Who this book is for
The course is designed for those who want to automate Excel tasks or procedures, for users with basic knowledge of Excel 2019/365, and those upgrading from previous software versions and a foundation of Microsoft Excel. Also, those who are seeking to advance their Excel 2019/365 knowledge can benefit from this course.
This course was recorded using Excel 2019 and Excel 365. It is also relevant to those using other, recent versions of Microsoft Excel, including Excel 2013 and 2016.