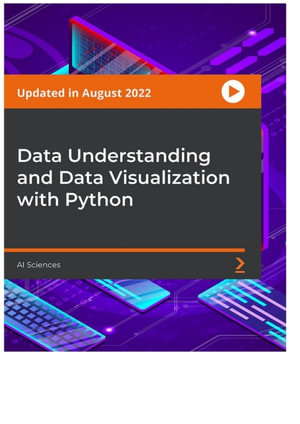
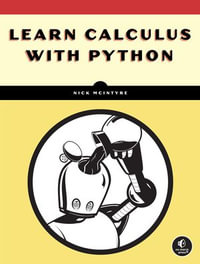
Learn to understand raw data and visualize it using Python along with hands-on mini projects.
Key Features
- Learn data manipulation and visualization with the help of a practical and easy-to-guide course
- Master various Python libraries such as NumPy, Pandas, Matplotlib, and so on
- Create interactive and insightful visualizations from scratch with minimal efforts
Book Description
Data visualization has gained a lot of traction resulting from an increased focus on data analytics. To be a successful data scientist, data manipulation and wrangling are not enough. Visualizing data to garner insights is an equally important tool in the data science toolkit. Given the myriad types of data that exist, visualization has become an increasingly important topic.
This course will equip you with all the skills you need to successfully create insightful visualizations. The course first starts with the fundamentals of Python. Then, the course teaches you how to use libraries such as NumPy, Pandas, Matplotlib, Seaborn, Bokeh, and so on. Additionally, you will learn data manipulation, which is the step prior to visualization. You will also learn how to plot geographical data using Folium. Each module in the course has practical hands-on mini projects, and with the mammoth content, this is one of the most comprehensive courses you will be doing on data visualization in Python.
By the end of this course, you have not only learned the theoretical fundamentals of visualizations but also gained essential practical skills to explore this growing domain.
The code files and all related files are uploaded on GitHub at: https://github.com/PacktPublishing/Data-Understanding-and-Data-Visualization-with-Python
What you will learn
- Study fundamentals of data manipulation and visualization
- Use Pandas and NumPy for data manipulation
- Handle text data with string
- Learn CRUD (Create, Retrieve, Update, Delete) operations on data
- Look at 3D visualizations with Matplotlib and Plotly
- Learn to create surface and scatter 3D interactive plots in Plotly
Who this book is for
This course is for anyone who seeks to perform data manipulations and create insightful visualizations. Even if you are an absolute beginner, you will benefit from this course as it begins with the fundamentals of Python and teaches you the necessary skills in using Python-based visualization libraries.